Working with Orchesty: From Code to Production
A developer walkthrough of the Orchesty workflow, from building custom components in your own environment to managing production integrations with zero downtime.
Most integration platforms force you into a browser-based editor with limited control. Orchesty takes the opposite approach: you write real code in your own IDE, and the platform handles orchestration, scaling, and observability around it.
1. Component Development: Ultimate Freedom #
In Orchesty, you don't build "inside a black box." You build in your own environment, using your favorite tools.
The SDK & Worker Model #
Every integration logic, connector, or filter is a Component. These components live inside Workers.

- Decoupled Development: A Worker is essentially a lightweight microservice with the Orchesty SDK installed. You develop in your own repository, using your own CI/CD pipelines.
- Open-Source Components: Orchesty's Components catalogue is fully open-source. You can inspect, fork, or extend any connector as needed.
- Simple Registration: To connect your local code with the platform, you register the Worker in the UI; it then receives a unique set of connection credentials and establishes a secure connection to the orchestration layer.
AI-Accelerated Engineering
To speed up the "boilerplate" phase, we publish ready-to-use AI rulesets.
- Simply describe the integration in your AI tool (e.g., Cursor, ChatGPT).
- The AI uses our SDK abstractions to generate connectors, handle OAuth, or even create a complete JSON Topology Schema.
- You then simply import the schema into Orchesty and start testing.
2. Orchestration & Debugging #
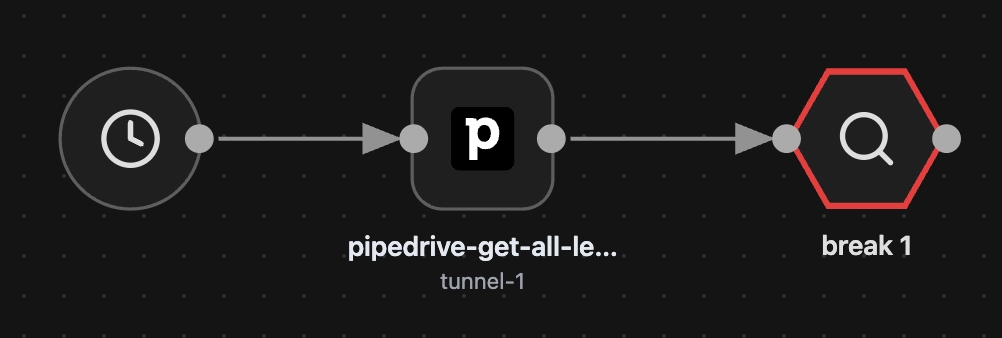
Once your components are registered, they appear as building blocks in the Visual Designer.
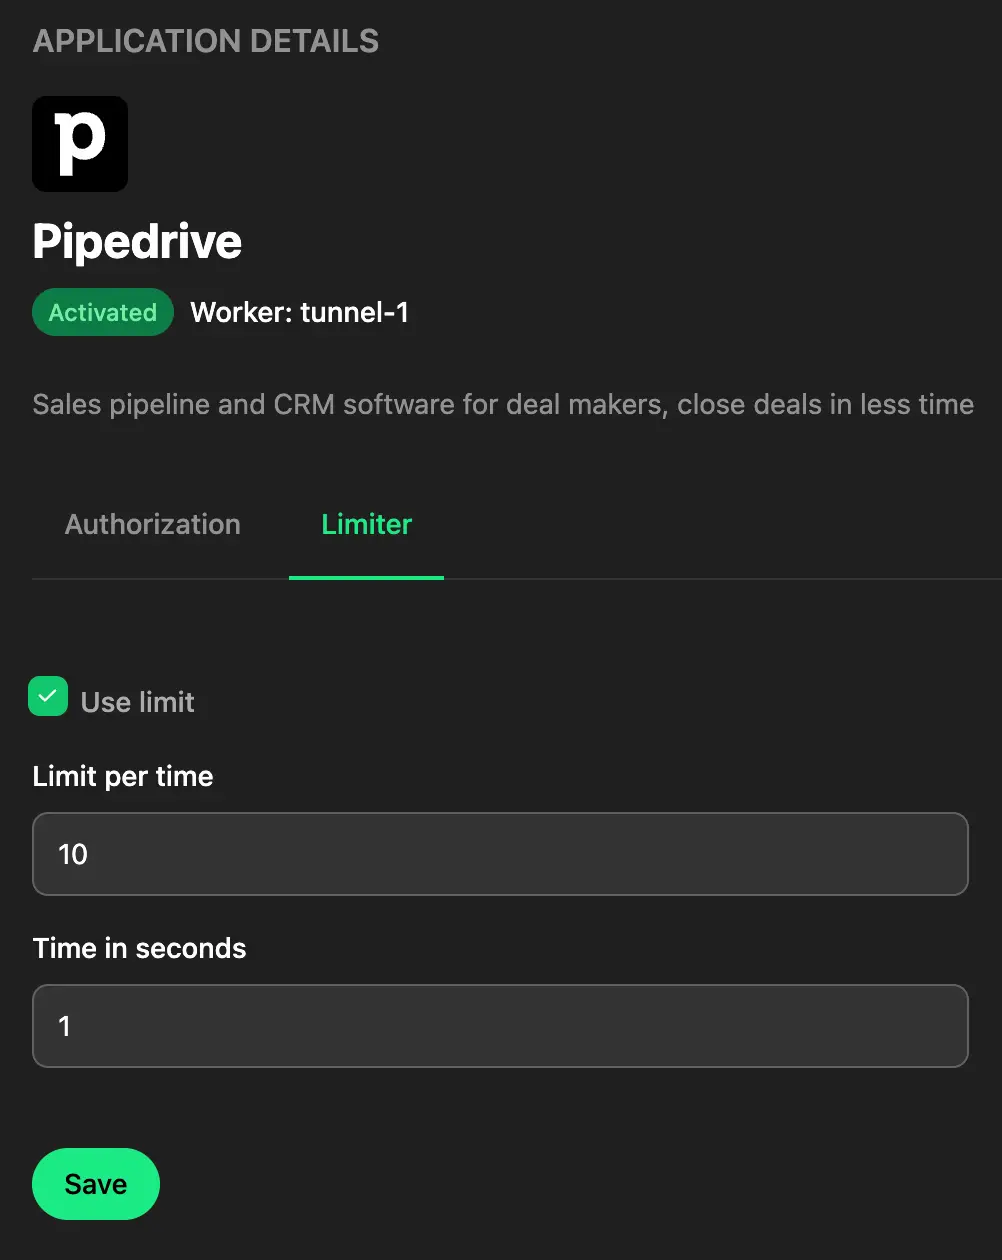
Configuration & Auth #
Before you drag-and-drop, you configure Apps. This is where you handle the "messy" parts of integrations:
- OAuth Flows: Orchesty manages user redirection and token refreshing.
- Rate Limiting: Set precise API limits required by the target vendor directly in the UI.
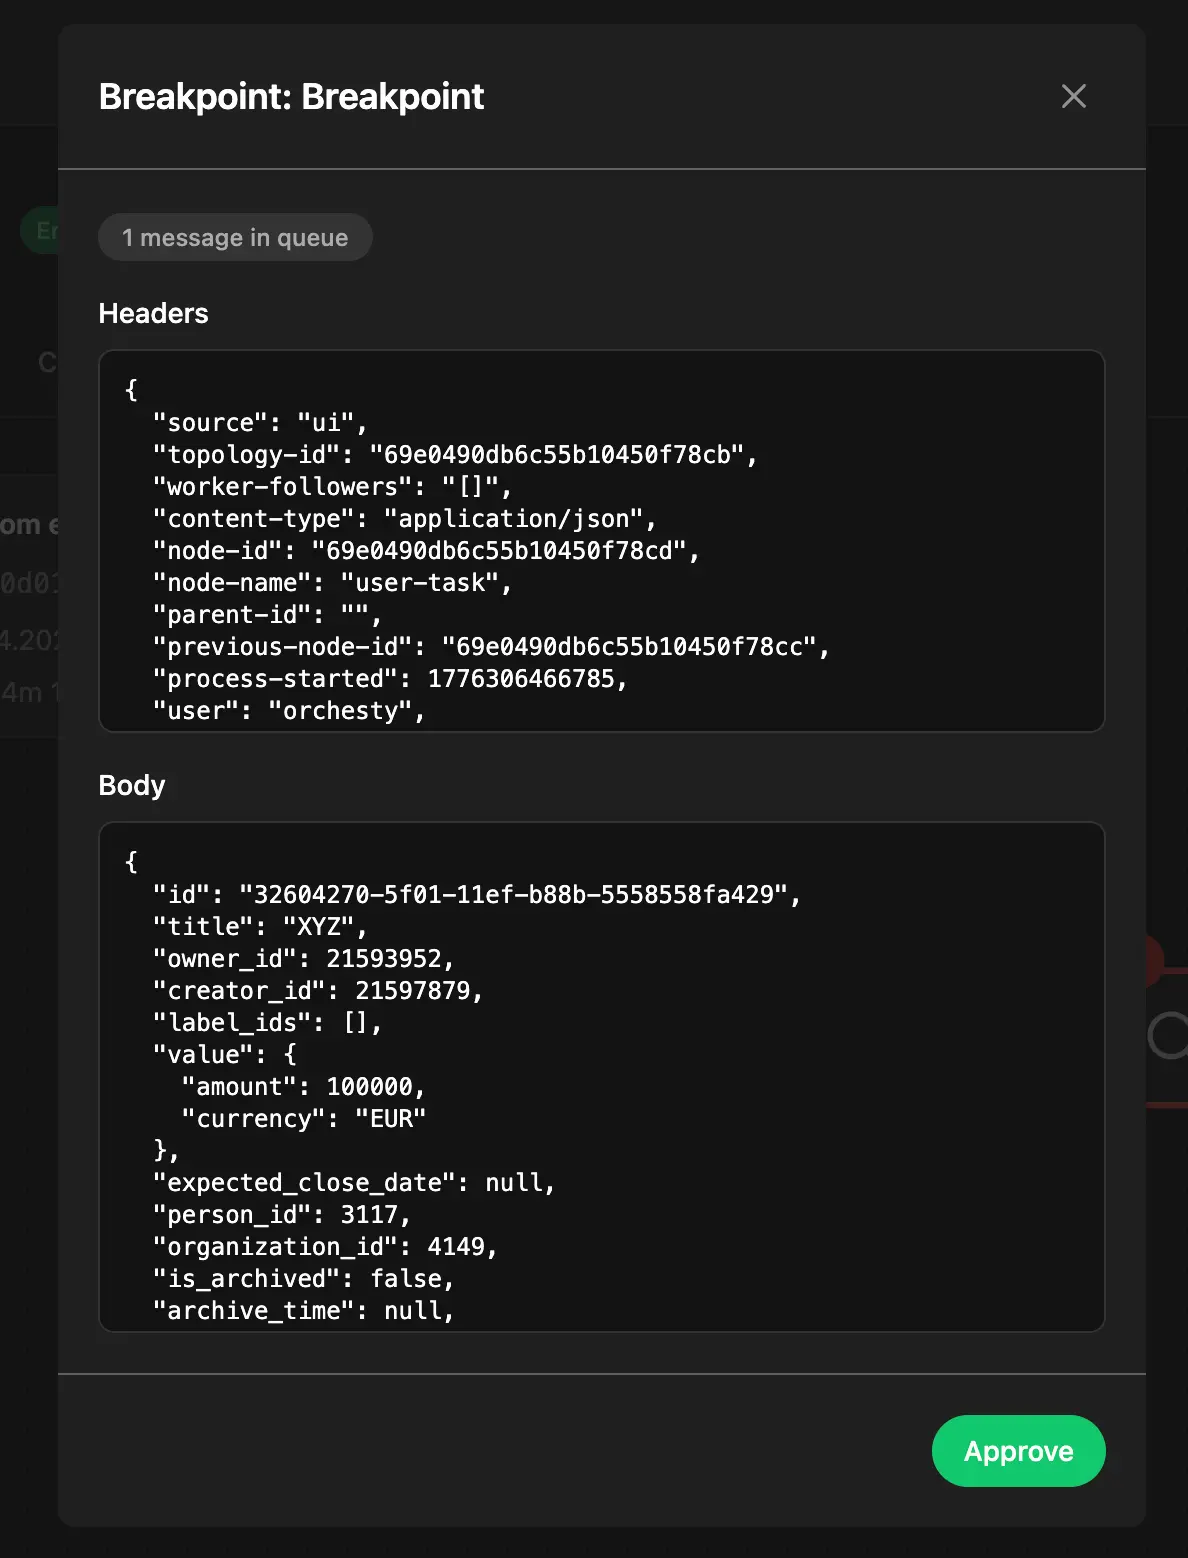
Smart Breakpoints #
Breakpoints make debugging asynchronous integrations practical. You can place Breakpoints anywhere in your topology.
- They allow you to manually step through an asynchronous process and inspect data at every node.
- Production Safe: Breakpoints only trigger for manual test runs. Automated tasks (CRON, Webhooks) bypass them entirely, ensuring production traffic is never interrupted.
3. Lifecycle & Versioning #
Orchesty treats integrations as living software, not static scripts.
- Zero-Downtime Deployment: Modifying a live topology automatically creates a new version.
- Seamless Switching: When you publish a new version, Orchesty ensures a lossless transition. In-flight processes from the previous version are allowed to finish, while new data is routed to the updated logic.
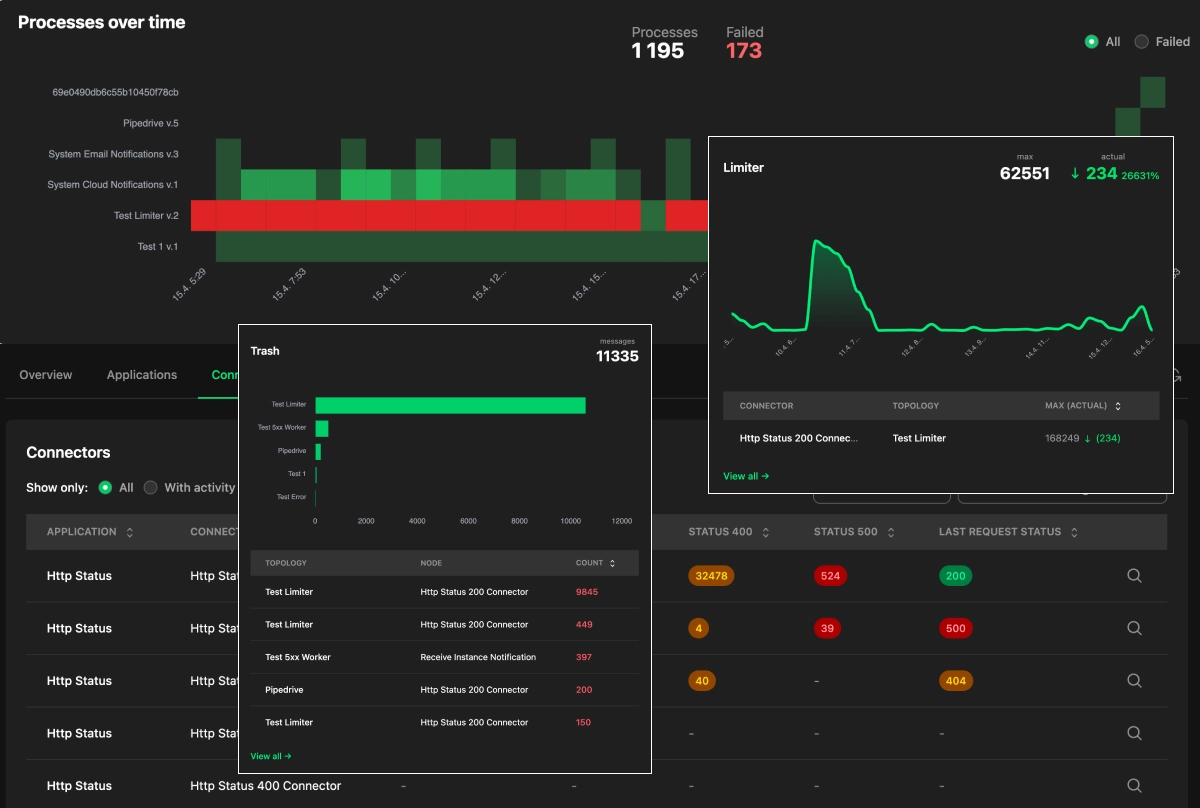
4. Production-Grade Operations (Observability) #
We believe the most important phase of an integration is its runtime. Orchesty provides deep observability into the "health" of your data:
- Limiter Insights: See exactly how many messages are queued behind a rate-limited application, the time it will take the queue to drain, and which topologies are contributing — with the option to terminate runaway processes from the same view.
- Error Recovery: If a process fails, you don't just get a log. You get the actual data packet. You can fix the data and re-inject it precisely at the point of failure.
- Resource Management: The platform proactively notifies you of resource spikes and suggests optimizations for your instance.
Audit & Governance (Pro & Enterprise)
For regulated workflows, the Trace capability turns the records the platform already writes to its process logs into per-entity reports: which service touched a given order, where it was sent, what state it was in at each step, and whether each boundary call actually delivered.
The history horizon is bound by your log retention — full multi-year audit is not currently sustainable. See Operational visibility for the canonical description and Trace auditing for the concept guide.
Where next #
- Hub overview: Five Core Principles
- What you're orchestrating: Topologies
- What runs your code: Workers & Components
- Why this asynchronous model wins: Streaming Integration